Disabilities
What we already know
Disabilities
Summary
More women than men in Scotland are disabled, while prevalence is similar for boys and girls. The proportion of people who are disabled increases significantly with age for both men and women.
Women are much more likely to be disabled if they live in more deprived areas, have lower income, or are white. Disabled women are far less likely than non-disabled women to report good general health and tend to have poorer mental wellbeing. They are less likely to do the recommended amount of physical exercise. Disabled adults of both genders are around twice as likely as those with no longstanding illness to be smokers (see Introduction below for a definition of disability).
Women are less likely to be employed if they are disabled, and poverty rates remain higher for families in which somebody is disabled compared to those without.
Disabled and non-disabled women are similarly likely to say that they personally contact relatives, friends or neighbours on most days, but disabled women fare worse in other measures of social capital.
All graphs and tables can be found in the PDF here.
Key FiguresIn 2017:
|
CONTENTS
Introduction
1.1 Disability and socio-economic status
1.2 Disability and ethnicity
1.3 Disability and sexual orientation
1.4 Disability among unpaid carers
2.1 General health
2.2 Physical activity
2.3 Diet
2.4 Alcohol and smoking
2.5 Life expectancy
3.1 Education
3.2 Employment
4.1 Poverty
4.2 Pay
4.3 Social security benefits
Introduction
This paper offers an overview of current evidence about disability in Scotland, from a gendered perspective. It is a summary overview, and is intended to be accessible for anyone regardless of whether or not they have existing knowledge about this area.
Disability is defined in the Equality Act 2010 as a physical or mental impairment that has a substantial and long-term adverse effect on a person’s ability to carry out normal day-to-day activities.[1] The key elements of this definition are that there is a long-lasting health condition and that this condition limits daily activity.
In Scotland, disability is usually measured in large-scale surveys using a two-part definition. The first part asks participants if they have a long-term illness or health condition that is expected to last more than 12 months. Second, participants are asked whether this condition limits their day to day activity, either by ‘a lot’ or ‘a little’.
In this paper we follow this definition, and figures relating to disabled people refer to those who have a long-term illness or health condition expected to last more than 12 months, and whose day-to-day activity is limited, either a lot or a little. In some places, where the data is available, figures for non-disabled people are broken down into those who do not have a longstanding illness and those who have a longstanding illness which is not limiting.
The Social Model of Disability
The social model of disability was developed by disabled people: activists who started the ‘Independent Living Movement’. Unlike the medical model, where an individual is understood to be disabled by their impairment, the social model views disability as the relationship between the individual and society. In other words, it sees the barriers created by society, such as negative attitudes towards disabled people, and inaccessible buildings, transport and communication, as the cause of disadvantage and exclusion, rather than the impairment itself. The aim, then, is to remove the barriers that isolate, exclude and so disable the individual.
1. How many people are disabled?
In 2017, the Scottish Health Survey estimated that 45% of adults (and 17% of children) had a long term condition or illness, and that 32% of adults (and 10% of children) had long-term conditions that were also limiting.[2] In this context, 32% of the adult population would be considered ‘disabled’, while 68% would be considered ‘not disabled’.
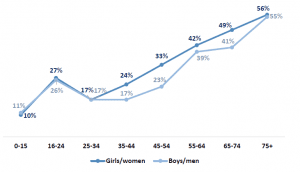
When this data is broken down by gender, we see that more women than men had limiting long-term conditions (34% vs 29% for those aged 16+), while prevalence was similar for boys and girls (11% and 10% respectively, for those aged 0-15). The graph below shows that while overall the proportion of disabled people increases with age for both men and women, in 2017 the 16-24 age group had significantly higher prevalence of limiting long-term conditions than those aged 25-34. This trend had not been observed in previous Scottish Health Survey reports, and it may be that the notably higher prevalence of disability in 2017 within this age group is an anomaly related to the sample size. Both women and men aged 75+ were more than 3 times as likely to be disabled than those aged 25-34.
Graph 1: Prevalence of limiting long-term conditions, by age and gender (Scottish Health Survey, 2017)
1.1 Disability and socio-economic status
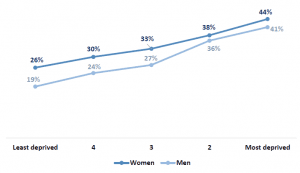
The proportion of women who are disabled is greater in the more deprived areas of Scotland (and the same is true for men). A quarter (26%) of women living in the 20% least deprived areas are disabled, compared to 44% of those living in the 20% most deprived areas, as Graph 2, below, shows (these figures are age-standardised).[3]
Graph 2: Prevalence of limiting long-term conditions, by gender and area deprivation, among individuals aged 16+ (Scottish Health Survey, 2017)
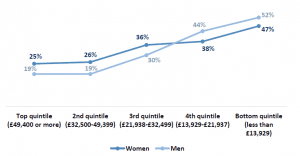
However, a slightly different trend is seen when prevalence of disability is broken down according to equivalised income (income adjusted to take into account variations in the size and composition of the households in which individuals live[4]). While there is again a higher proportion of disabled women than disabled men among those in the top three income quintiles, there is a higher proportion of disabled men than disabled women in the bottom two income quintiles (those with an equivalised income of less than £21,938).[5] These figures are age-standardised. For women, the proportion of women who are disabled rises from 25% for those with the highest incomes to 47% among those with the lowest incomes (a change of 22 percentage points). For men, the prevalence of disability rises from 19% for those with the highest incomes to 52% for those with the lowest incomes – a greater difference than for women, with a change of 33 percentage points.
Graph 3: Prevalence of limiting long-term conditions, by gender and equivalised income, among individuals aged 16+ (Scottish Health Survey, 2017)
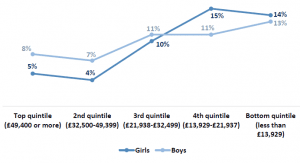
A reversed trend can be seen among children, however, with a higher proportion of disabled boys among those on higher incomes, but a higher proportion of disabled girls among those on the lowest incomes. Graph 4 demonstrates this.
Graph 4: Prevalence of limiting long-term conditions, by gender and equivalised income, among children aged 0-15 (Scottish Health Survey, 2017)
1.2 Disability and ethnicity
The sample in the Scottish Health Survey is too small to analyse disability by ethnicity (or ethnicity and gender). The 2011 Scottish Census, however, showed that women and girls of all ethnic groups other than ‘white’ were less likely than the average to report a disability, as the graph below shows.[6] A similar trend was observed for men.
Graph 5: Prevalence of limiting long-term conditions among women and girls, by ethnicity (Scotland’s Census 2011)
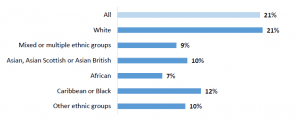
As the census showed, minority ethnic groups typically have younger age profiles than the population as a whole which, given that prevalence of disability increases with age, may partially explain reduced rates of disability.[7]
1.3 Disability and sexual orientation
Analysis of the Scottish Core Survey questions found that, in 2017, 29% of those identifying as lesbian, gay, bisexual and ‘other’ reported limiting long-term conditions, compared to 23% of those identifying as heterosexual.[8]
1.4 Disability among unpaid carers
Women and girls who provide regular care for family members, friends, neighbours or others because of a long-term physical condition, mental ill-health or disability; or problems related to old age are more likely to be disabled themselves than those who do not. In 2011, 27% of female carers had a long-term health problem or disability that limited their day-to-day activities, compared to 20% of women and girls who were not carers.[9] The proportion of girls and women with conditions which limited their day-to-day activities ‘a lot’ was the same for both carers and non-carers (10%), but 16% of female carers had a health problem or disability that limited their activities ‘a little’, compared to 10% of non-carers. In 2017, 21% of disabled women aged 16+ were carers, compared to 17% of non-disabled women.[10]
The reason for the differences in carers’ health and wellbeing could be partly explained by the fact that carers tend to be older and the likelihood of developing an illness or disability increases with age. However, it is not necessarily clear whether caring has an effect on health or whether people who have poor health are more likely to become carers.[11]
2. Health
2.1 General health
Disabled women were far less likely than non-disabled women to report good or very good general health in 2017, and far more likely to report having bad or very bad general health, as the graph below shows. Just 37% of disabled women said that their health was good or very good in 2017, compared to 84% of those with a non-limiting longstanding illness, and 92% of those without longstanding illness.[12]
Graph 6: Self-assessed general health, among women aged 16+, by longstanding illness (Scottish Health Survey, 2017)
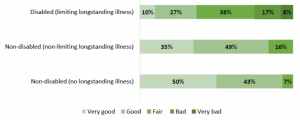
The picture was similar for men among those who were disabled and among those without any longstanding illness, but among those with a non-limiting longstanding illness men were less likely than women to report very good health and more likely to report bad or very bad health.
Graph 7: Self-assessed general health, among men aged 16+, by longstanding illness (Scottish Health Survey, 2017)
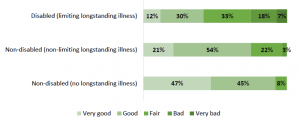
As with women aged 16 and over, girls aged under 16 were also more likely to report bad health and less likely to report good to very good health if they were disabled. Just over half (56%) of disabled girls reported good or very good health in 2017, compared to 98% of those without longstanding illness (and 94% of those with a non-limiting longstanding illness).
Graph 8: Self-assessed general health, among girls aged <16, by longstanding illness (Scottish Health Survey, 2017)
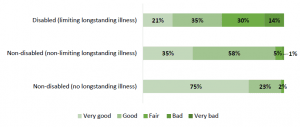
As with girls, disabled boys were less likely than non-disabled boys to report good health and more likely to report bad health. A higher proportion of disabled boys than disabled girls reported good or very good general health (69% vs 56%) and a lower proportion reported bad or very bad health (5% vs 14%).
Disabled women were more likely to experience poor mental wellbeing than those who were non-disabled in 2017. While disabled women had a mean score of 45.3 on the Warwick-Edinburgh Mental Wellbeing Scale (WEMWBS), those who had no longstanding illness had an mean score of 51.9.[13] A similar trend was seen among men. The WEMWBS has 14 items designed to assess: positive affect (optimism, cheerfulness, relaxation) and satisfying interpersonal relationships and positive functioning (energy, clear thinking, self-acceptance, personal development, mastery and autonomy). The lowest score possible is 14 and the highest score possible is 70; the scale was not designed to identify individuals with exceptionally high or low levels of positive mental health so cut off points have not been developed.
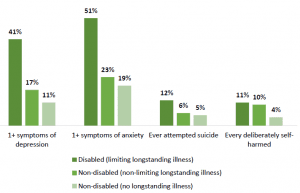
As Graph 9 below shows, disabled women were more than twice as likely as those who were non-disabled to report experiencing one or more symptoms of depression or anxiety in 2017, and around twice as likely to report having ever attempted suicide. Disabled women were around three times as likely as those without longstanding illness to report ever having deliberately self-harmed, but prevalence was similar for those with non-limiting longstanding illness as for disabled women (those with limiting longstanding illness).[14]
Graph 9: Report of anxiety, depression, suicide and self-harm among women aged 16+, by longstanding illness (Scottish Health Survey, 2017)
2.2 Physical activity
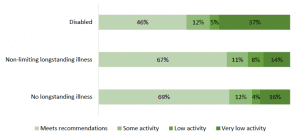
Disabled women are much less likely than non-disabled women to do the recommended amount of physical activity (150 minutes of moderate activity or 75 minutes of vigorous activity per week), and far more likely to have very low physical activity levels. Just under half (46%) of disabled women met physical activity guidelines in 2017, compared to over two thirds of those who had no longstanding illness (69%) or who had a non-limiting longstanding illness (67%).[15]
Graph 10: Physical activity levels among women aged 16+, by limiting longstanding illness (Scottish Health Survey, 2017)
When asked about their reasons for not doing any sport or exercise, or for not doing more of it, disabled women were more likely to say that their health wasn’t good enough (50% vs 6%), they had no one to do it with (6% compared to 3% of those with no long-term illness), that they were afraid of injury (6% vs 1%), or that they might feel uncomfortable or out of place (6% vs 3%).
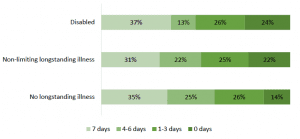
Girls aged 2-15 are more likely not to do the recommended 60+ minutes of physical activity on any day in a week if they are disabled, but they are also slightly more likely to do the recommended amount on all 7 days (including activity at school), as the graph below shows.[16]
Graph 11: Number of days girls aged 2-15 met physical activity recommendations (60 mins+) including activity at school, by limiting longstanding illness (Scottish Health Survey, 2017)
Disabled people often find the cost of accessible equipment required to allow them to participate in sports to be prohibitive.[17] Those with mental health conditions report feelings of intimidation as a barrier to participation; this can include being intimidated by those facilitating or participating in the sport, by attending alone, or by the environment more widely. Self-consciousness and low levels of confidence with regards to sport have also been found to be significant barriers for those with other disabilities.[18] Lack of information, support, appropriate facilities and transportation have also been found to prevent many disabled people from doing sport.
2.3 Diet
Disabled women had fewer portions of fruit and veg per day on average than women without a longstanding illness in 2017 (3.1 vs 3.6).[19] The same trend was true of men (2.8 vs 3.4). Figures for those with non-limiting longstanding illness were similar to those with no longstanding illness – 3.6 for women and 3.5 for men.
Disabled girls aged 2-15 had an average of 2.6 portions per day, compared to 3.0 for those without longstanding illness and 2.9 for those with non-limiting longstanding illness (although this last figure should be treated with caution due to a low base). [20]
Disabled boys had an average of 2.6 portions, compared to 2.7 for those with non-limiting longstanding illness and 2.9 for those without longstanding illness.
2.4 Alcohol and smoking
Disabled adults (16+) are around twice as likely as those without longstanding illnesses to be current cigarette smokers, although rates are higher among men. A quarter (25%) of disabled women were current smokers in 2017, compared to around a seventh (14%) of women without longstanding illnesses and a tenth (9%) of those with non-limiting longstanding illness (these figures were 36%, 17% and 15% respectively for men).[21]
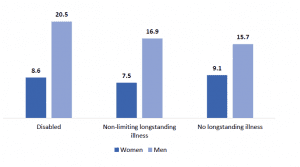
Among individuals who drink alcohol, men tend to drink around twice as many units of alcohol per week than women on average, with disabled men drinking more than non-disabled men. The picture is not quite so clear for women, however, as the graph below shows.[22]
Graph 12: Mean number of units of alcohol per week (drinkers), by gender and limiting longstanding illness (Scottish Health Survey, 2017)
2.5 Life expectancy
Statistics concerned with premature mortality are not broken down in relation to disability. However research from England, published in 2013, found that men and women with learning disabilities died sooner than those without learning disabilities, by an average of 13 and 20 years respectively.[23]
3. Work and education
3.1 Education
College courses (both FE and HE) taken by disabled students were less likely to be successfully completed than those taken by non-disabled students. This was true for both male and female students. However, the difference in successful completion rates was greater for female than male students: 73.7% of courses taken by disabled female students were successfully completed against 79.8% of non-disabled female students (difference of 6.1 percentage points), while for male students these figures were 82.1% and 77.9% respectively (difference of 4.2 percentage points).[24]
3.2 Employment
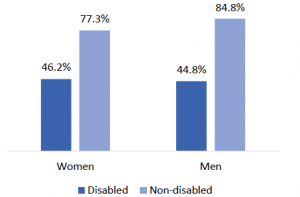
Women are less likely to be employed if they are disabled. In 2018 the disability employment gap was lower for women (31.1 percentage points) than men (40.0 percentage points).[25]
Graph 13: Employment rate (16-64), by disability and gender (Annual Population Survey, 2018)
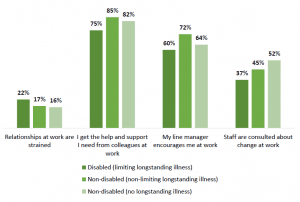
Disabled women in paid work were similarly likely to non-disabled women to say that their job was very or extremely stressful in 2015-2017 combined (15% of disabled women, 14% of those without longstanding illness and 16% of those with a non-limiting longstanding illness).[26] However, there were some differences in how disabled women felt about other aspects of their work, as the graph below shows.
Graph 14: Proportion of women aged 16+ in employment who strongly agree or tend to agree with certain statements about work, by limiting longstanding illness (Scottish Health Survey, 2015-2017 combined)
A higher proportion of female employees with a disability were trade union members in 2017 than those without a disability (37% vs 30%); the same was true for men (27% vs 22%).[27]
4. Poverty and income
4.1 Poverty
The most common way to measure poverty is by looking at household income, which means that a man and woman living in the same household are counted either as both being in poverty, or both not in poverty. So gender breakdowns of poverty statistics often focus on single adults i.e. those who are the only adult in the household.
Among working-age single adults without children, men and women tend to have a similar risk of poverty.[28] However, if single adults with dependent children (i.e. lone parents, the vast majority of whom are women) are included, women tend to have a slightly higher risk of poverty than men. Poverty rates among single pensioners tend to be higher for women than men.
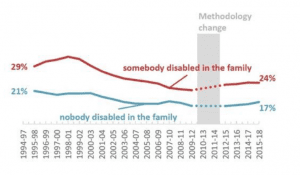
Poverty rates remain higher for families in which somebody is disabled compared to those without. The gap between the two groups has remained fairly steady over the last few years. In 2015-18, the poverty rate after housing costs for people in families with a disabled person was 24% (440,000 people each year). This compares with 17% (600,000 people) in a family without a disabled person.
Graph 15: Proportion of people in relative poverty after housing costs (1994-2018)
Between 2015/16 and 2017/18, 31% of children with a disabled person in the household were in relative poverty after housing costs. For families without a disabled member, the comparative figure was 21%.[29]
Disabled women are around 3 times as likely as those without a longstanding illness to experience food insecurity (with disabled men around 4 times as likely as men without longstanding illness). In 2017, 17% of disabled women (and 20% disabled men) said that they had worried they would run out of food because of a lack of money or other resources in the last 12 months, compared to 5% of women without longstanding illness (and 5% of men).[30]
4.2 Pay
35% of disabled women (and 30% of disabled men) were paid below the Living Wage in the UK in the period up to 2014 (compared to 25% of non-disabled men and 29% of non-disabled women in the same period).[31]
The Equality and Human Rights Commission uses data from the Labour Force Survey to estimate pay gaps related to different conditions. For people with epilepsy, for example, the pay gap for women in the period studied was around 20% and around 40% for men.[32] The gap was 10% for women with anxiety and depression, alongside 30% for men and 60% for men with learning difficulties (the gap for women is not statistically significant). The report notes that men with physical impairments generally experience pay gaps between 15% to 28%, while the difference between non-disabled women’s pay and that of women with physical impairments ranges from 8% to 18%.
Research from the Office for National Statistics (based on 2018 data) found that 27% of the difference between the mean non-disabled pay and disabled pay at UK level can be explained by other characteristics they used to model pay.[33] These included things like gender, age, working pattern, region, occupation, ethnicity and qualifications. The research found that the largest positive contribution to the difference in pay came from occupation, explaining 18% of the gap. Other important factors include qualification, explaining 7%.
4.3 Social security benefits
The Scottish Government are becoming responsible for some of the benefits currently delivered by the Department for Work and Pensions (DWP). As part of work to prepare for this change, Scottish Government set up the Social Security Experience Panels. The Panels are working with people who have recent experience of benefits currently delivered by DWP to help design a new social security system with the people of Scotland. The Panels will run until all the benefits are up and running, and are made up of over 2,400 people with recent experience across the benefits which will be devolved to Scotland, which include disability benefits. A large programme of research and co-design is underway with panel members. Publications relating to the Panels can be found here.
Four-fifths (83%) of the 1,275 panel members who responded to 2017 and 2018 surveys about their demographics said that they had a disability or long term health condition.[34] Half were physically disabled (53%), suffer from chronic pain (52%) or have another long term condition (56%). Almost two in five (38%) had a mental health condition. Some respondents had multiple disabilities or long term health conditions.
So far, their research has found that particular priorities for panel members include having simple, clear and timely processes; flexible approaches; friendly, helpful and knowledgeable staff; and accessibility and inclusivity.[35]
Some more specific findings include:
- More than half (60%) of respondents rated their experience of the current benefits system as ‘poor’ or ‘very poor’. 18% rated their experience as ‘good’ or ‘very good’.[36]
- The majority of respondents (71%) listed ‘advice and support about claiming’ as a priority for Scottish Government to improve in the new social security system. More than half listed ‘applying for a benefit’.[37]
- Attendance Allowance helped participants to maintain independence, supplement the additional day to day costs arising from their health condition and helped ensure their financial stability. In practice, this meant things such as purchasing meals and paying for taxis. Several participants said that without the benefit, they would not be able to meet their financial commitments.[38]
- Many respondents want to be able to complete application forms online.[39]
- Participants would prefer indefinite awards to be introduced in the case of unchanging conditions, to reduce the need for unnecessary re-assessments.[40]
- Participants generally responded positively to the idea of light touch reviews, which would be primarily paper-based, with many viewing them as a significant improvement over the existing regime of face-to-face health assessments.[41]
- Respondents preferred booking options that allowed them the freedom to choose when and where health assessments would take place.[42] When asked what factors were important to choose when booking a health assessment, respondents said the most important was being able to choose an assessor who had knowledge of their specific medical condition. Many respondents felt that having an assessor who was knowledgeable about their health condition would lead to a higher quality assessment through a more accurate assessment report. The location and time of the assessment also ranked highly.
- Almost all respondents felt that 16 was not the right age for recipients of Disability Living Allowance to transition to receiving Personal Independence Payment (PIP).[43] It was suggested that 18 was a more suitable age, although many respondents said they would prefer the age of transition to be 20. Transitioning at 16 was seen to be ‘an extra stress on the parents’ and many thought that children were still too young at 16 to move on to PIP.
Respondents suggested that an extra two years would ‘give the parent more time to teach their child about their benefits’.
5. Discrimination, justice and social capital
In 2015-2017 combined, 3% of disabled women aged 16+ reported having experienced discrimination because of mental ill-health in the past 12 months, and 5% reported having experienced discrimination because of other health problems or disability.[44] These figures were 3% and 4% respectively for men.
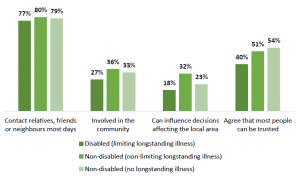
Disabled and non-disabled women are similarly likely to say that they personally contact relatives, friends or neighbours on most days (77% of disabled women said this in 2015-17 combined, compared to 79% of women without longstanding illness), as Graph 16 shows.[45]
However, disabled people are more likely than non-disabled people to say that they are not at all involved in their community, with women experiencing this to a lesser extent than men. Thirty-two percent of disabled women said that they were not at all involved in their community in 2015-17 combined, compared to 22% of women without longstanding illness. These figures were 41% and 27% respectively for men. 27% of disabled women said that they were involved ‘a great deal’ or ‘a fair amount’, compared to 33% of women without longstanding illness, as shown in Graph 16.
Disabled people were also somewhat less likely to feel that they could influence decisions affecting their local area – 18% of disabled women agreed or strongly agreed with this statement in 2015-17 combined, compared to 23% of women without longstanding illness.
Disabled people are also less likely that those without to have a good level of trust in other people. In 2015-17 combined, 40% of disabled women agreed that most people can be trusted (and 38% of disabled men), compared to 54% of women without longstanding illness (and 55% of men).[46]
Graph 16: Various measures of social capital among women aged 16+, by limiting longstanding illness (Scottish Health Survey, 2015-2017 combined)
Women with a disability or long-term illness are far more likely to experience partner abuse than those without – 17% of women with a disability or long-term illness in England and Wales had experienced domestic abuse in the last year as of March 2018, compared to 6% of those without.[47]
45.6% of board members for public bodies in Scotland were women at the end of 2017.[48] This was an increase of 0.5 percentage points from the year before, and an increase of 11.1 percentage points from 2004/5. However, the percentage of board members that were disabled fell, from 9.2% to 7.9%.
References
Data sources drawn on in this report collect self-reported data on whether respondents are male or female. The term gender is therefore used throughout this report, although though some data sources use the term sex in their research.
For the full list of references, graphs, tables and a downloadable PDF please follow this link.